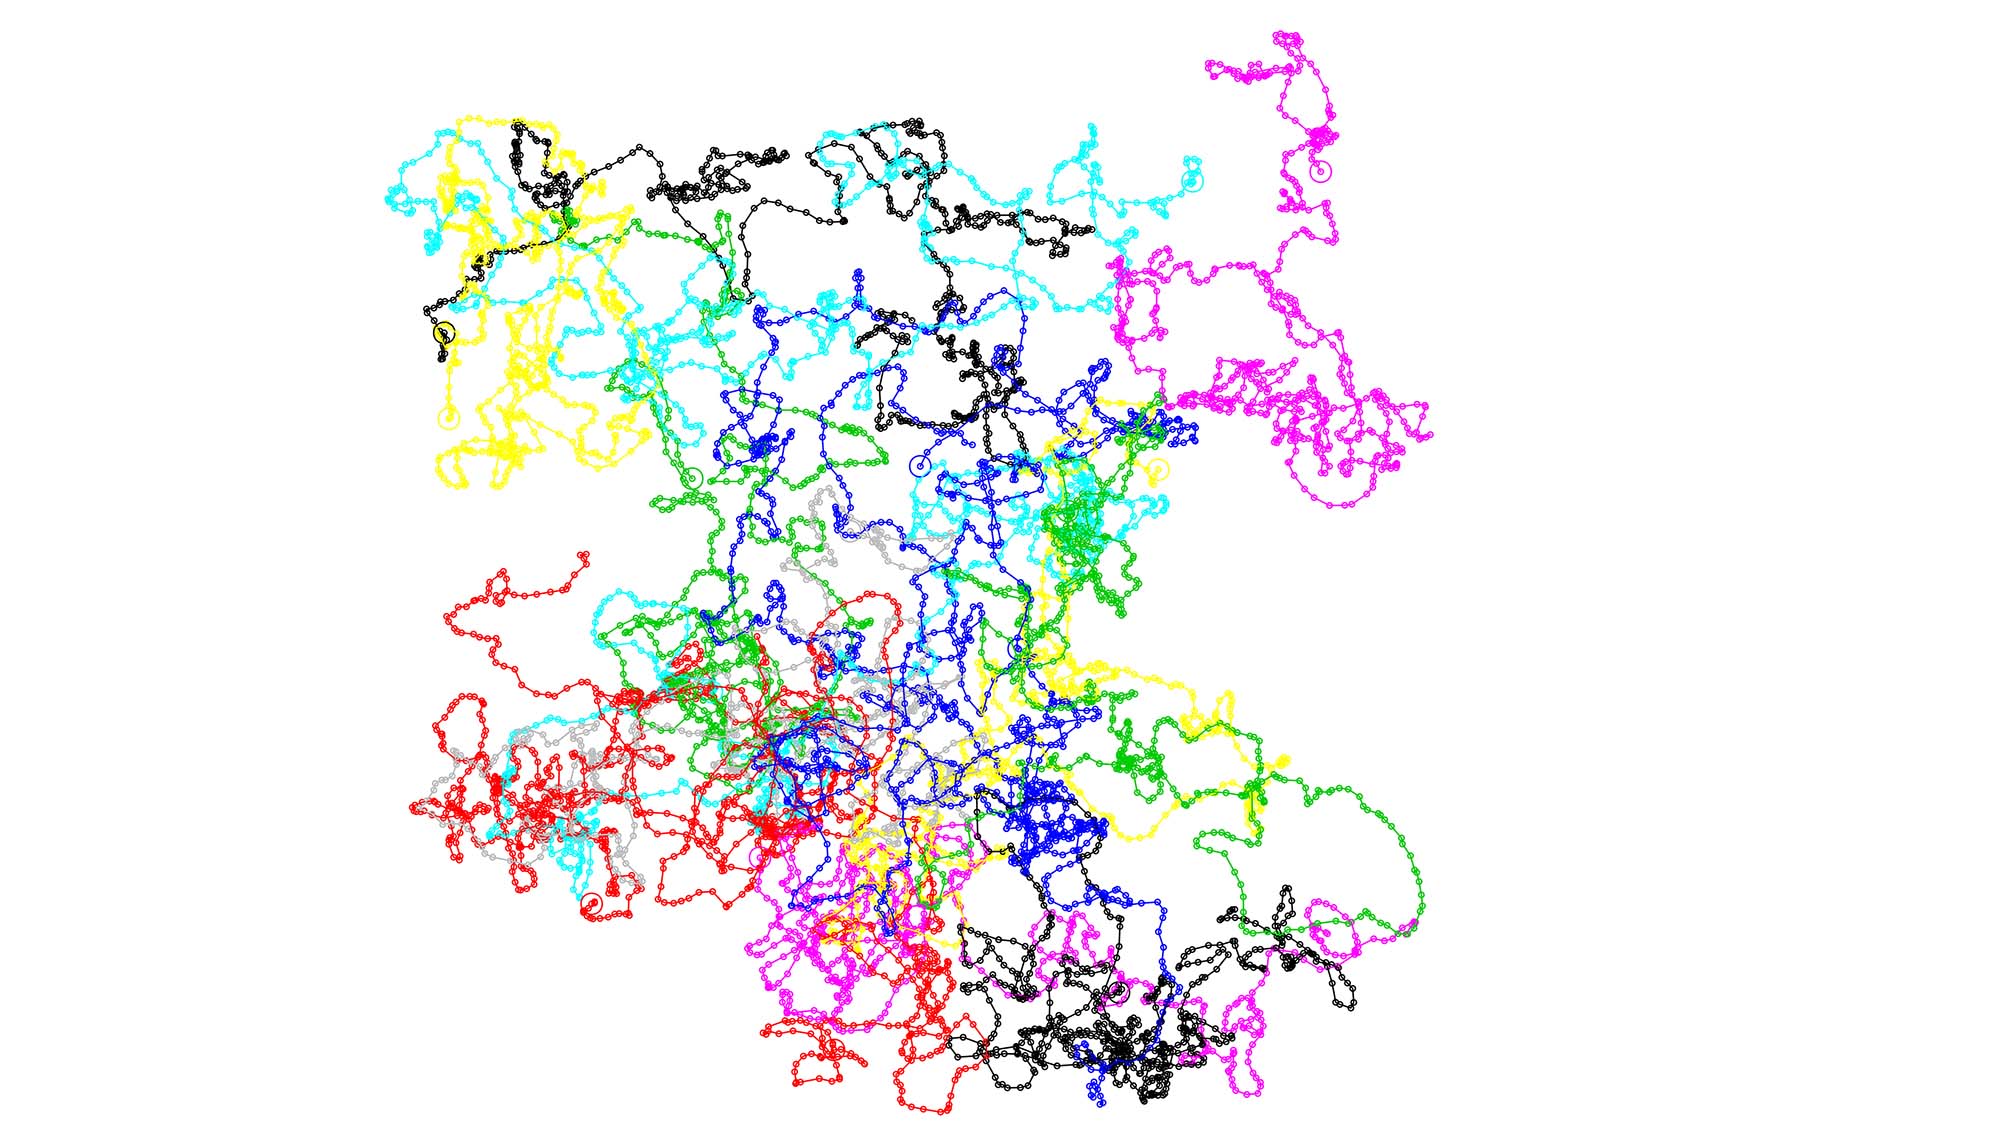
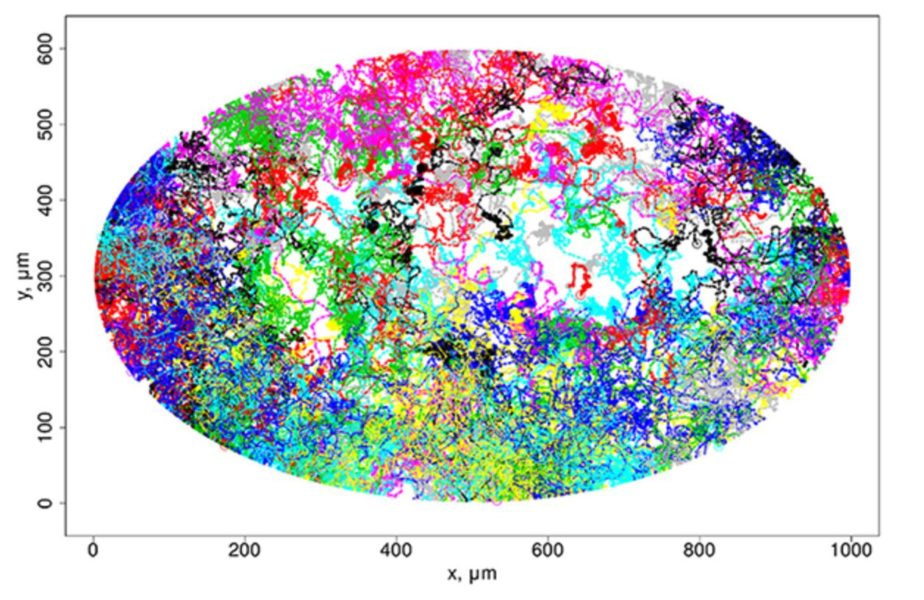
In this image we can visualize the motility of immune cells in lymph nodes when an individual is infected by HIV as predicted by the mathematical model. The trajectory of 15 T lymphocytes during 5 hours in the lymph nodes can be seen, each one represented in a different colour. A subset of T lymphocytes, cytotoxic T cells, are in charge of attacking and destroying infected or cancerous cells.
The image belongs to a study led by Gennady Bocharov, a Marchuk Institute of Numerical Mathematics researcher in Russia, with the collaboration of the ICREA professor at Department of Experimental and Health Sciences, Pompeu Fabra University (DCEXS-UPF) Andreas Meyerhans. The researchers described a mathematical model which helps to predict the activity of the immune system against an infection, in this case by HIV.
They took images from lymph nodes and quantified T lymphocyte movements, regarding the spatial trajectory which we see represented in the image.
The described mathematical model and subsequent in-silico-simulations allow to define how many immune cells are necessary in the lymph nodes to block the expansion of HIV. Newton second’s law (that the product of velocity and mass equals the sum of the forces affecting a body) allowed them to formulate the governing equations of the model, because each of the more than 12,000 T lymphocytes studied follow this law in their movement.
The authors used their mathematical model and subsequent in-silico-simulations to define how many immune cells are necessary in the lymph nodes to block the expansion of HIV.
By simulating in a computer the propagation of the infection using this model, researchers have seen how T cell motility determines their ability to identify and destroy HIV-infected cells. It is known that infected cells release viral particles between 18 and 24 hours since the beginning of the infection. To avoid this from happening, a certain amount of active T cells are necessary before the 18 hours – according to this model, 5% of the total amount of cytotoxic T-cells.
But during an HIV infection, the connective tissue of the lymph nodes grows. This reduces the motility of lymphocytes and may mean that there is not enough time to stop the propagation of the virus. Therefore, this model suggests that future vaccines against HIV should aim to get more than 5% active, antigen-specific, cytotoxic T-cells and guarantee their normal motility.
This model could be adapted to study other infectious diseases and help developing immune cell thresholds to beat them.
Funding sources: the Russian Science Foundation, the RUDN University ‘Program 5-100’, the Spanish Ministry of Economy, Industry and Competitiveness and FEDER and the “María de Maeztu” Programme for Units of Excellence in R&D.
Would you like to see your photo here? Please send us pictures related to science or the PRBB to ellipse@prbb.org.
Grebennikov Dmitry, Bouchnita Anass, Volpert Vitaly, Bessonov Nikolay, Meyerhans Andreas, Bocharov Gennady. Spatial Lymphocyte Dynamics in Lymph Nodes Predicts the Cytotoxic T Cell Frequency Needed for HIV Infection Control. Frontiers in Immunology, June 2019. DOI: 10.3389/fimmu.2019.01213.