With age, ovaries contain fewer and fewer oocytes. But, according to a new study from the Centre for Genomic Regulation (CRG), this loss does not appear to happen passively. The results suggest that the ovary could adjust how many oocytes leave the resting state depending on the size of its reserve.
The study, published in Nature Aging, has reconstructed in three dimensions how the mouse ovary changes throughout its reproductive lifespan. To do so, the team combined light-sheet microscopy and artificial intelligence to count and classify the oocytes in more than 100 intact ovaries. In total, it analysed more than 85.000 cells.
A stable proportion throughout life
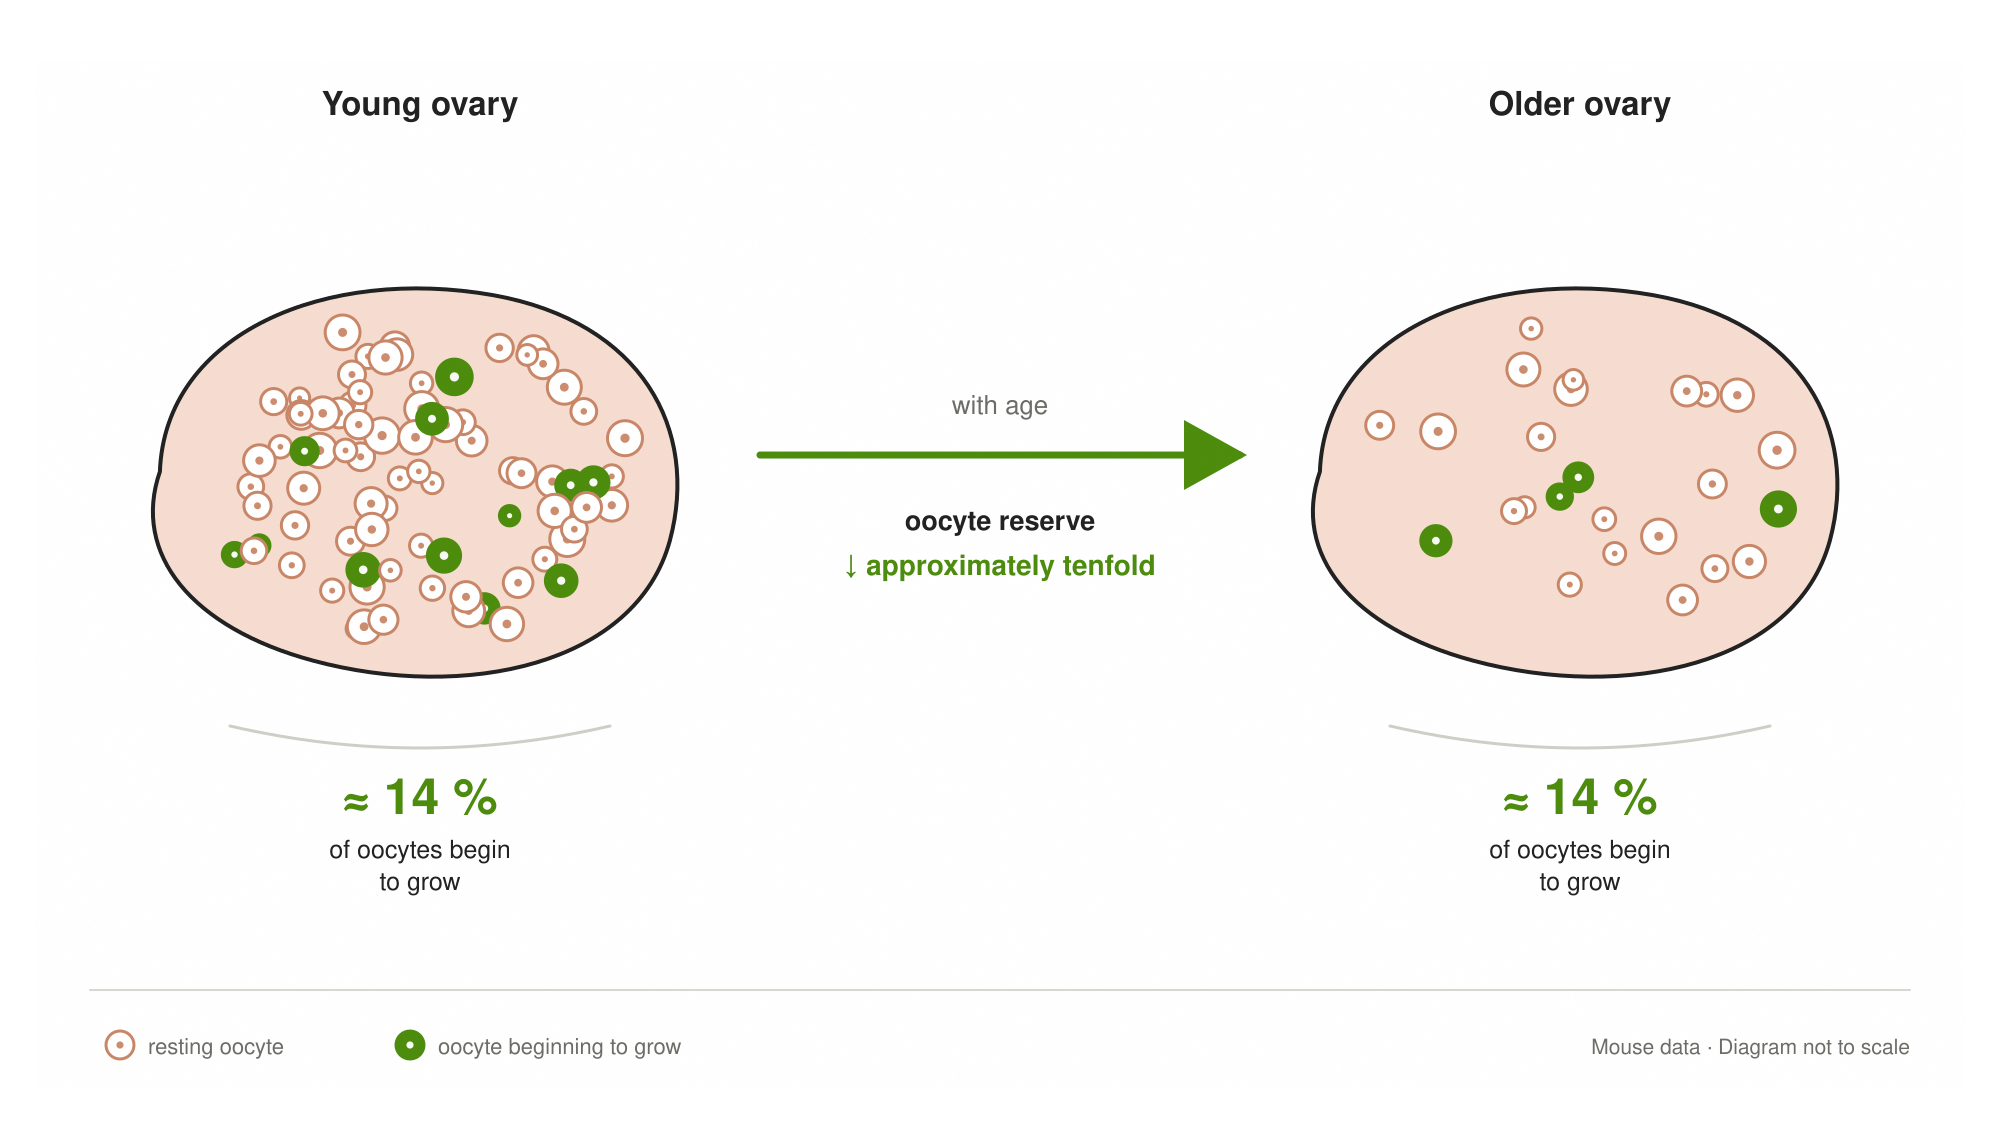
The analysis shows that the oocyte reserve decreases approximately tenfold with age. Even so, the proportion of oocytes in the transition between the resting state and growth remains stable, at around 14 %.
This regularity suggests that the ovary does not simply work as a store that gradually empties over time. According to the team, there could be a mechanism capable of detecting the size of the reserve and adjusting the number of oocytes that are activated. The signal responsible, which could be hormonal or neuronal, is still unknown.
The ovary does not seem to activate a fixed number of oocytes, but rather to maintain a stable proportion.
The map has also revealed important differences between very similar animals. By the time they reached puberty, some mice had up to three times more oocytes than others, despite being from the same genetic strain, being the same age and having grown up in the same conditions.
These differences were already observed in young animals, suggesting that they could originate during the earliest stages of development.
Observing the whole ovary
Until now, much of what was known about the ovarian reserve came from the analysis of thin tissue sections. This method makes it possible to study one part in great detail, but makes it difficult to obtain a complete view of the organ.
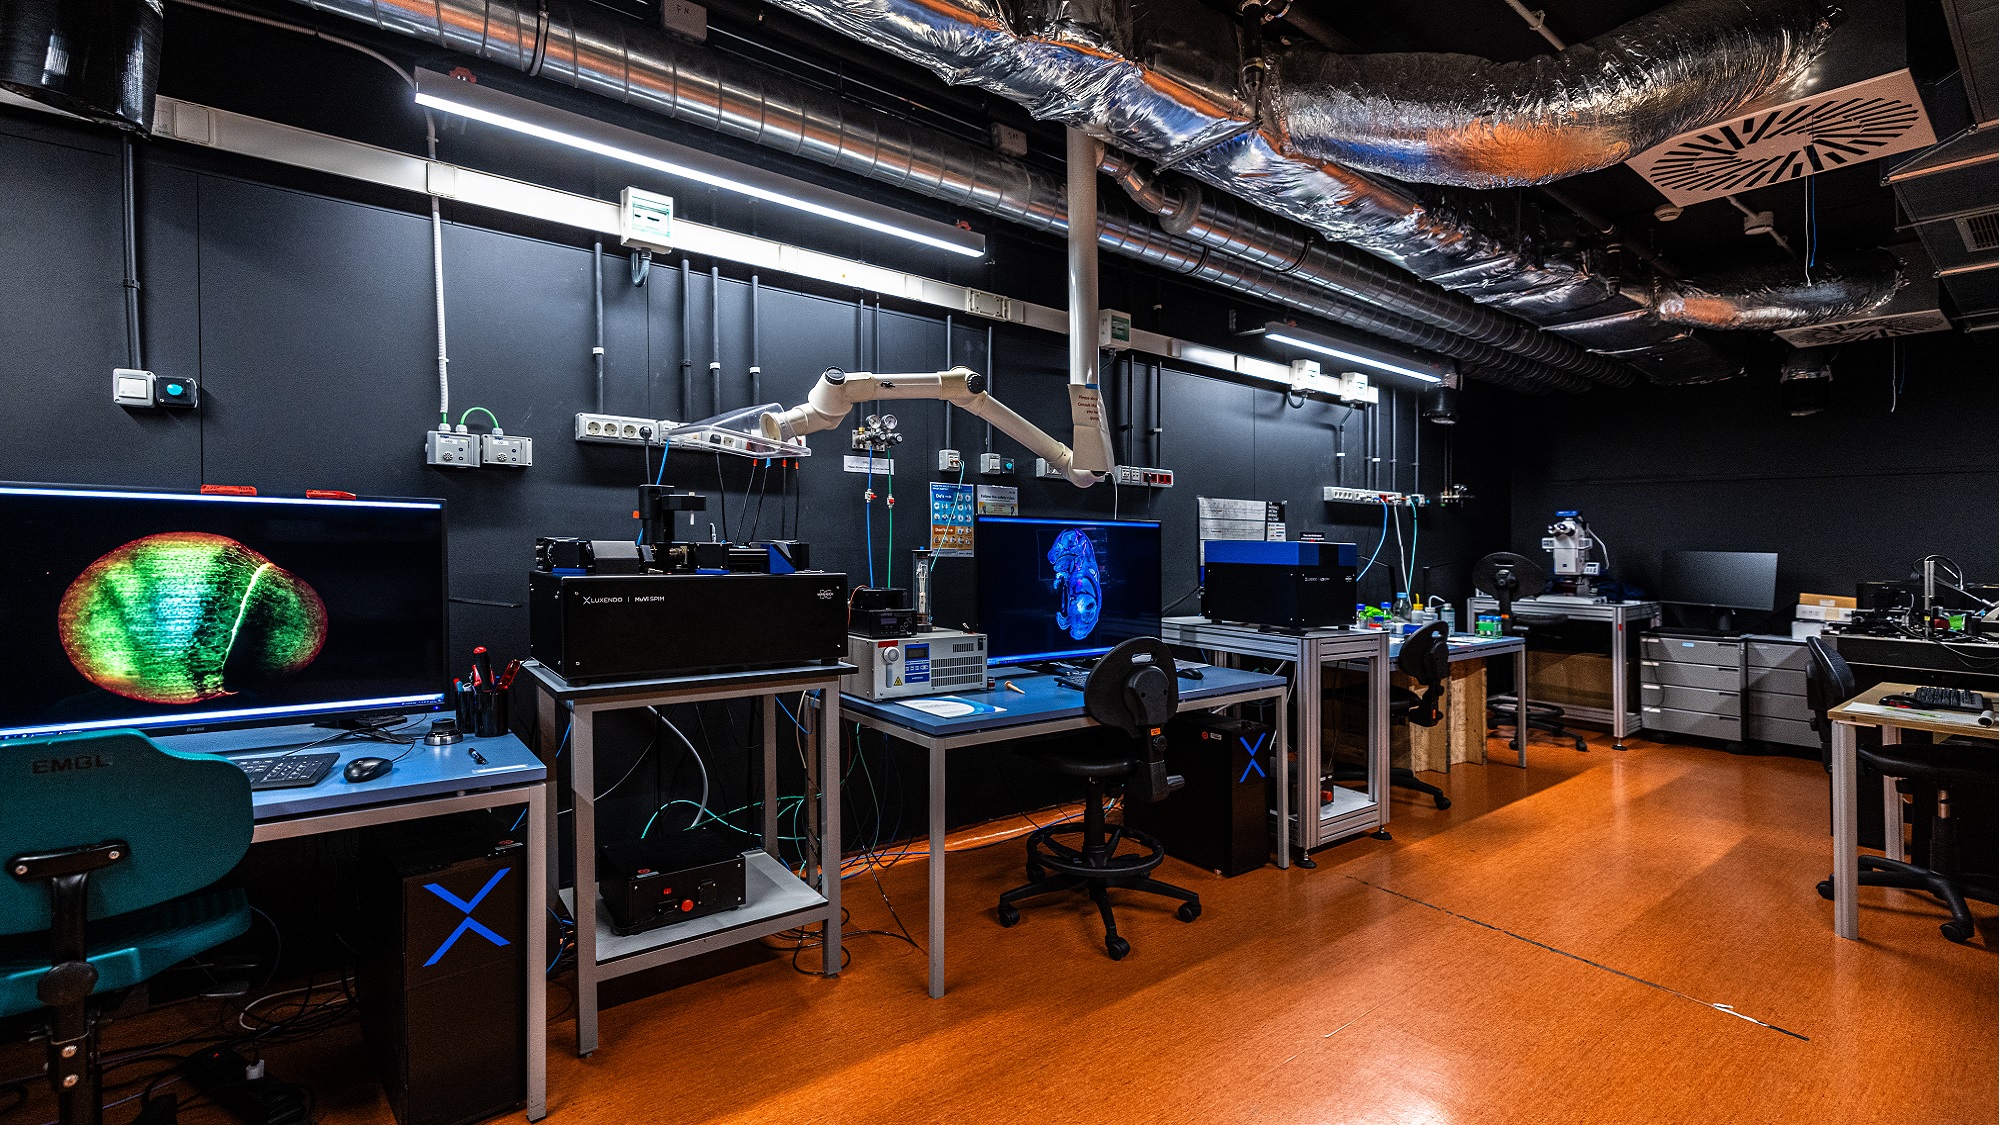
In this study, the ovaries were made transparent so that they could be observed whole. The images were obtained using light-sheet microscopy at the EMBL Barcelona Mesoscopic Imaging Facility, located at the PRBB. An artificial intelligence system then identified and classified each oocyte within the three-dimensional volume.
This approach does not only makes it possible to count oocytes. It also helps locate them within the ovary and see how they are distributed in space. In fact, the study identifies patterns in oocyte location and a possible bottleneck at a specific stage of their growth.
Seeing the whole ovary makes it possible to understand not only how many oocytes there are, but also where they are and what state they are in.
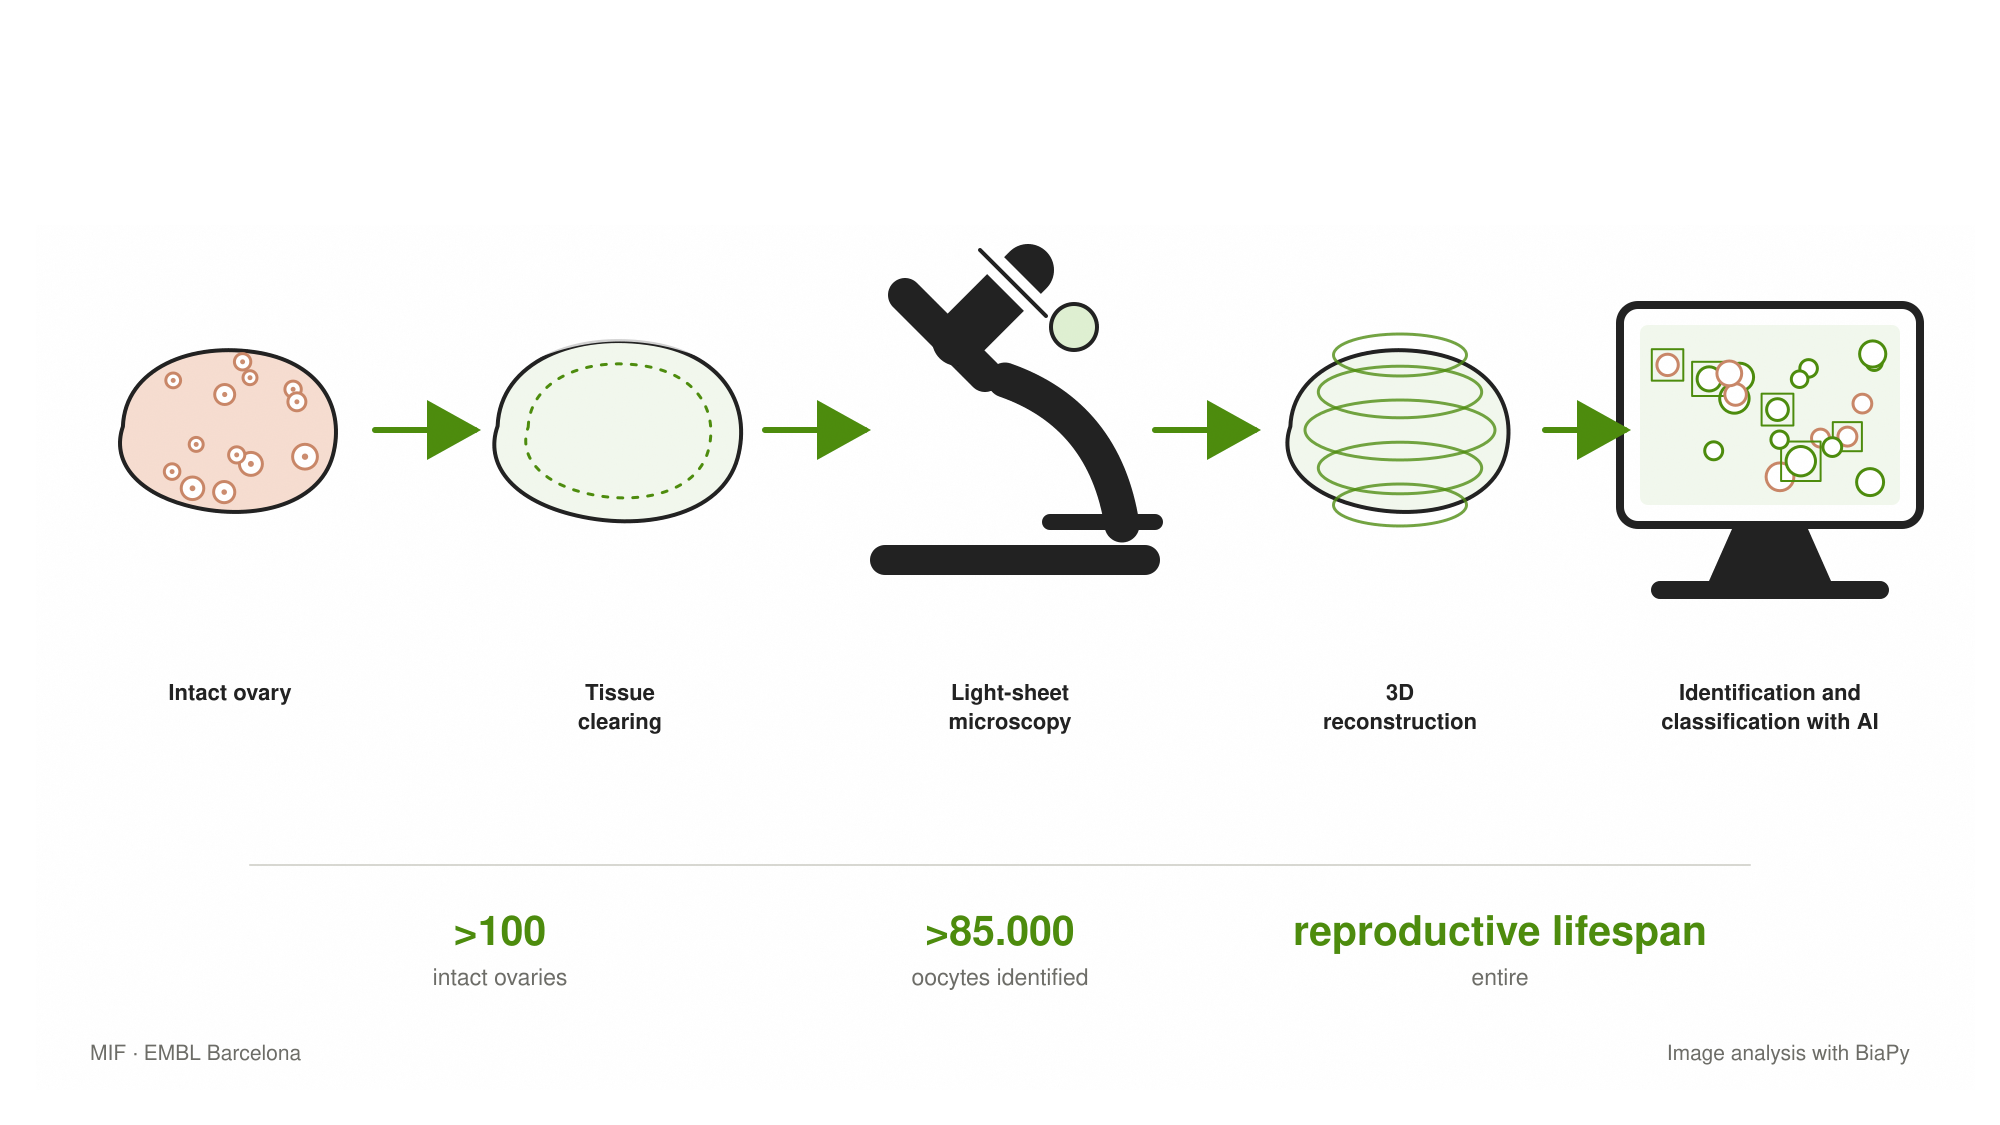
The team has shared the procedure, images and artificial intelligence model through BiaPy, an open image analysis platform. This will allow other laboratories to reproduce the work and apply the method to new samples.
And in humans?
The technique has also been tested on human ovarian tissue samples and could facilitate future studies on the ovarian reserve. However, the results on the proportion of oocytes that begin to activate come from mice, which have a very different reproductive rhythm from ours.
Therefore, it cannot yet be stated that human ovaries regulate their reserve in the same way. The new map does, however, provide a tool to investigate this question by observing the organ as a whole.
D’Angelo, A., Franco-Barranco, D., Musy, M., Sharpe, J., Arganda-Carreras, I. & Böke, E. (2026). Three-dimensional mapping of intact ovaries reveals the aging dynamics of the ovarian reserve. Nature Aging. doi: 10.1038/s43587-026-01178-z.